-
Productos
-
Accesorios
- ADAPTADORES
- CABLES
- CALCULADORAS
- CARRY DISK
- DATA SWICTH
- ESTUCHES
- FAN COOLER
- FUNDAS
- HUB USB
- LECTOR DE MEMORIAS
- LIMPIEZA LUBRICACION
- MALETINES
- MOCHILAS
- MORRALES
- PAD DE MOUSE
- PLACAS ADAPATADORAS
- SINTONIZADORAS TV
- SOPORTE LCD
- TABLETAS DIGITALIZADORAS
- CONTROL REMOTO
- CAPTURADORAS
- ORGANIZADOR DE CABLES
- EXTENSORES DE SEÑAL
- SPLITER SWITCH
- SOPORTE CELULAR
- TERMOMETRO
Accesorios - Almacenamiento
- Audio
-
Computadoras
- ALL IN ONE
- PC
- PC Y MONITOR
- WORKSTATIONS
Computadoras - Control de Acceso
- Energia
-
Equipos Audiovisuales
- LAMPARAS
- PANTALLAS
- SOPORTES
- Proyectores
- ACCESORIOS
- VIDEO CONFERENCIA
- PANTALLAS INTERACTIVA
Equipos Audiovisuales - Escaners
- Hardware
- Impresion
- Insumos
- Networking
-
Pantallas
- MONITORES
- TELEVISORES
- MONITOR PROFESIONAL
- DISPLAY
Pantallas -
Portables
- Notebooks
- Tablets
- ACCESORIOS
Portables - Punto de Venta
-
Servidores
- ACCESORIOS
- SERVIDORES
- STORAGE
- DATA CENTER
Servidores - Seguridad
- Software
- Telefonia
-
Herramientas
- KIT DE HERRAMIENTAS
- ALICATE
- DESTONILLADOR
Herramientas -
Energia Solar
- Paneles
Energia Solar - Vehiculos Electricos
- ROBOT
-
Accesorios
-
Marcas
- ADAPCORP - ASUS
- ADAPCORP - ACER
- ADAPCORP - DELL
- ADAPCORP - HP
- ADAPCORP - LENOVO
- ADAPCORP - SAMSUNG
- ADAPCORP - SONY
- ADAPCORP - TOSHIBA
- ADATA
- ADOBE
- AFOX
- AMERISOLAR
- AMP
- AMD
- ACER
- ACTI
- AOC
- APC
- APPLE
- AIRLIVE
- ARGOS
- ARKTEK
- ARECONT VISION
- ASROCK
- AUO
- ALCATEL
- AUSVO
- AUTODESK
- ASUS
- ALLIED TELESIS
- AMAZON
- ARMOR
- APEX
- ANVIZ
- ATEN
- AVER
- AVIOSYS
- AXIS
- BAGS
- BANANA
- BELKIN
- BGH
- BANGHO
- BENQ
- BOREAL
- BROTHER
- CASIO
- CASELOGIC
- CMOS
- CANON
- CASECOM
- CASECOM
- CIFRA
- CISCO
- CSL
- CIRKUIT PLANET
- COMPUTAR
- COLORFUL
- COLL MASTER
- CX
- COMODORE
- COUGAR
- CRUCIAL
- CSB
- DAHUA
- DJI - PHANTOM
- DELTA
- DELL
- DCELL
- D-LINK
- DINSTAR
- DUMONT
- DRAYTEK
- EATON
- EDIFIER
- ENCORE
- ELF
- EGI
- AMAZON
- EMERSON
- EPSON
- ESET Endpoint
- EVGA
- EXAKTUS
- E-VIEW
- EZVIZ
- EXO
- EnergyControl
- FARGO
- FOLKSAFE
- FORTINET
- FUJITSU
- FURUKAWA
- FULLMARK
- FIREFLY
- GAINWARD
- PROFIBER
- FUJI
- GABITEL
- GAMEMAX
- GARMIN
- GATEWAY
- GRANDSTREAM
- GALAXY
- GAMDIAS
- GENERICA
- GENERAL ELECTRIC
- GENERAL ELECTRIC
- GENIUS
- GCT
- GREYSAND
- GIGABYTE
- GoPro
- GLC
- G.SKILL
- HASAR
- HIKVISION
- HP
- HP - ALTERNATIVO
- HITACHI
- HONEYWELL
- HUBBELL
- HYUNDAI
- HP - BEATS
- HILTRON
- HUAWEI
- HYNIX
- I3 TECHNOLOGIES
- INNO3D
- IBM
- IBM - LENOVO
- IMATION
- INSTABATT
- INTEL
- IRIS
- INTELAID
- INTCO
- INGINET
- JBL
- JINKO
- KAISE
- KRAMER
- KINGSTON
- KOZUMI
- KASPERSKY
- KWorld
- KRONE
- KGUARD
- KRETZ
- KODAK
- LACIE
- LIEBERT
- LINKWORLD
- LENOVO
- LG
- LEXMARK
- LOCH
- LiteOn
- Liteon - Acer
- LINKSYS
- LOGITECH
- MANHATTAN
- MakerBot
- MCAFEE
- MIKROTIK
- MSI
- LUSTIG
- LENKENG
- MERAKI
- MAXTOR
- MOTOROLA
- MOW SPORT
- MEGATON
- MEMOX
- MIMOSA
- MICROSOFT
- MICROSOFT ACADEMICO
- MICROSOFT OLP
- MLOGIX
- MXQ
- NORTON
- MUSHKIN
- NEC
- NEO
- NISUTA
- NOGANET
- NOBLEX
- NOVATECH
- NSX
- NEWLAND
- OLEX
- OPTOMA
- OKIDATA
- OLIVETTI
- OLYMPUS
- PHILCO
- PACIFIC WIRELES
- Packard Bell
- PACIFIC WIRELESS
- PANDA
- PROCO
- PERFORMANCE
- PLANTRONICS
- PANASONIC
- POLYESTER
- PELCO
- PHILIPS
- PHILIPS
- PNY
- PNY
- POLARIS
- PORTDESIGNS
- POWER COOLER
- RAINBOW
- RCA
- ROSSLARE
- REALTEK
- SAMSUNG
- SANGOMA
- SEAGATE
- SATO
- SEWOO
- SENTEY
- SOLYTECH
- SIEMENES
- SONY
- fCASE
- SURIX
- TCL
- TARGUS
- THERMALTAKE
- THONET & VANDER
- TRIMAKER
- THERMALTAKE
- TRIPLE KIT
- TP-LINK
- TELTRON
- TRV
- TRENDNET
- TRUST
- OCOM
- ONEBIT
- OVERTECH
- PATRIOT
- POLAROID
- PORT DESIGNS
- PROKIT
- PLUNIX
- QNAP
- RF ELEMENTS
- RAYOVAC
- ROKU
- SANDISK
- SEAWAG
- SUPERMICRO
- STEEL
- SYMBOL
- SYSTEM SENSOR
- SYX
- TECMETRO
- TOMI
- TOSHIBA
- TOPOWER
- TYCO - FAYSER
- UBIQUITI
- VIEWSONIC
- WACOM
- XIGMATEK
- X-PRO
- YEALINK
- VIDIUM
- VISION
- VOXSON
- VERBATIM
- WESTERN DIGITAL
- HannStar
- Innolux
- UNITECH
- ULTRACELL
- XVIEW
- WEKI
- LUSTIG
- SkullCandy
- XEROX
- XFX
- ZOM
- ZEBRA
- 3nStar
- SMART
- RUIJIE
- SCHNEIDER ELECTRIC
- YOUJIE
- MOBOX
- YUASA
- ZOTAC
- E-WIN
- PROX
- FLUKE
- WAVLINK
- SANYO
- SYBLE
- Synway
- V-SOL
- XIAOMI
- Servicios IT
- Infraestructura
- Catalogo
- Contacto

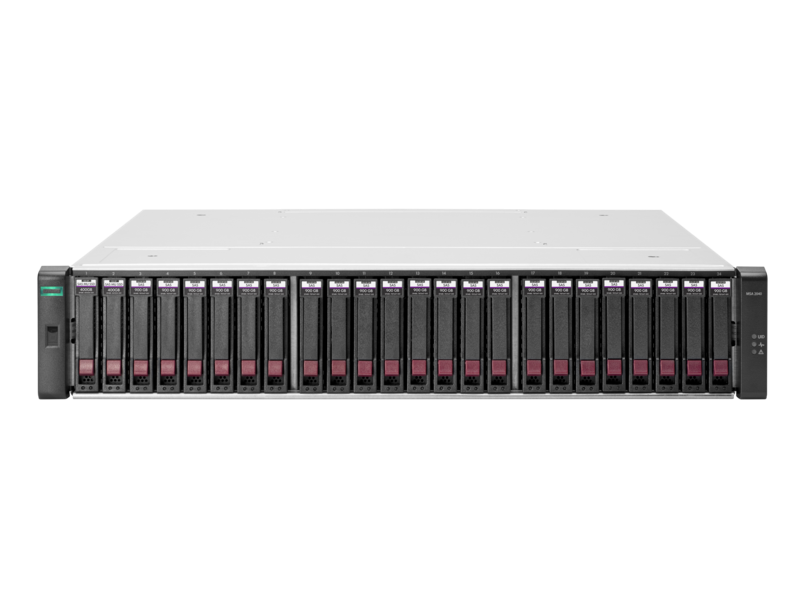
HPE MSA 2040 ES LFF Chassis
PROD. x PEDIDO
Nivel de stock: Consultar Disponibilidad
Cod: K2R82A
Consultar
Contacta para recibir más información
Tel: 4372-9595 WhatsApp +54 9 11 6 745-9595 info@greysand.com.ar
Hasta 12 cuotas sin interés
Ver promociones bancarias
Envíos a todo el país
Más información
Pick up en tienda
Ver ubicación
K2R82A HPE MSA 2040 ES LFF Chassis
HPE MSA 2040 Storage
|
ENERGY STAR certified HPE MSA 2040 is a high-performance storage array designed for entry-level Hewlett Packard Enterprise customers desiring 8Gb/16Gb Fibre Channel, 1GbE/10GbE iSCSI, or 12Gb SAS connectivity with 4 host ports per controller. The MSA 2040 Storage array provides an excellent value for customers needing performance balanced with price to support initiatives such as consolidation and virtualization. The MSA 2040 delivers this performance by offering:
- MSA 2040 SAN Controller ú 8Gb/16Gb FC connectivity and/or ú 1GbE/10GbE iSCSI connectivity - MSA 2040 SAS Controller ú 6Gb/12Gb SAS connectivity The HPE MSA 2040 Storage ships standard with a license for 64 snapshots for increased data protection. The MSA2040 now offers a simplified licensing strategy with one optional software suite. The Advanced Data Services Suite include the following software licenses: - HPE MSA 2042 Performance Automated Tiering LTU - HPE MSA 512-Snapshot Software LTU - HPE MSA Remote Snap Software LTU |
|||
|
|
|||
|
|
|||
|
HPE MSA 2040 Storage (SFF) |
|||
|
|
|||
|
|
|||
|
HPE MSA 2040 Storage (LFF) |
|||
|
|
|||
|
|
|||
|
MSA 2040, 2 SAN controllers installed |
|||
|
1. |
Power supplies |
4. |
Management Ethernet port |
|
2. |
8 and/or 16Gb Fibre Channel, 1 and/or 10GbE iSCSI |
5. |
Expansion port |
|
3. |
CLI port (mini-USB) |
|
|
|
|
|||
|
MSA 2040, 2 SAS controllers installed |
|||
|
1. |
Power supplies |
4. |
Management Ethernet port |
|
2. |
6Gb/12Gb mini-SAS HD ports |
5. |
Expansion port |
|
3. |
CLI port (mini-USB) |
|
|


Models
|
HPE MSA 2040 Storage |
MSA 2040 Controller: |
|
|
HPE MSA 2040 SAN Controller |
C8R09A |
|
|
HPE MSA 2040 SAS Controller |
C8S53A |
|
|
MSA 2040 Pre-Configured Models: |
||
|
HPE MSA 2040 Energy Star SAN Dual Controller LFF Storage1 |
K2R79A |
|
|
HPE MSA 2040 Energy Star SAN Dual Controller SFF Storage2 |
K2R80A |
|
|
HPE MSA 2040 Energy Star SAS Dual Controller LFF Storage3 |
K2R83A |
|
|
HPE MSA 2040 Energy Star SAS Dual Controller SFF Storage4 |
K2R84A |
|
|
NOTES: 1Includes LFF Array Chassis + two MSA 2040 SAN controllers, no drives or SFPs are included 2Includes SFF Array Chassis + two MSA 2040 SAN controllers, no drives or SFPs are included 3Includes LFF Array Chassis + two MSA 2040 SAS controllers, no drives or host connect cables are included (SFP’s not required for SAS controllers) 4Includes SFF Array Chassis + two MSA 2040 SAS controllers, no drives or host connect cables are included (SFP’s not required for SAS controllers) |
Features
|
ENERGY STAR Certified |
The HPE MSA 2040 SKU’s are now ENERGY STAR certified. ENERGY STAR certified products are energy efficient which result in cost savings via reduced energy consumption and regulatory rebates. Please refer to the US EPA website for details on ENERGY STAR certification criteria and process. MSA 2040 ENERGY STAR Certification is listed on the EPA website
As a part of gaining ENERGY STAR certification, MSA 2040 SKUs were required to change such that Hewlett Packard Enterprise and our customers can delineate between product shipped before the EPA recognized the MSA 2040 as ENERGY STAR compliant and arrays shipped after the MSA 2040 obtaining the official certification.
No physical changes were made to the MSA 2040 or any of its components to pass the ENERGY STAR compliance testing other than SKU numbering and labels (physical and electronic). There are no physical, form, fit or function differences between the older and the ENERGY STAR compliant HPE MSA 2040 SKU’s.
No new qualification or testing is required in order to use/substitute the new ENERGY STAR certified SKU’s.
NOTE: The EOL SKU’s in the table below were discontinued on July 31, 2015. The replacement ENERGY STAR SKU’s are listed below.
Table showing the replacement HPE MSA 2040 ENERGY STAR SKU’s
|
||||||||||||||||||||||||||||||||
|
HPE MSA 2040 |
The HPE MSA 2040 Storage arrays (SAN or SAS Controllers) connected 2U storage area network (SAN) or direct connect solution designed for network equipment providers (NEPs) and communication service providers. Suited for those who need a robust telecom infrastructure.
The NEBS compliant MSA 2040 supports configurations with up to 7 compliant disk enclosures for a maximum of 192 SFF HDD´s.
|
|
|||||||||||||||||||||||||||||||
|
MSA DC-power Carrier-grade SFF Chassis |
SKU |
|
|||||||||||||||||||||||||||||||
|
HPE MSA 2040 SFF DC-power Chassis NOTE: NEBS certified |
C8R11A |
|
|||||||||||||||||||||||||||||||
|
|
|
|
|||||||||||||||||||||||||||||||
|
MSA 2040 Controller: |
|
|
|||||||||||||||||||||||||||||||
|
HPE MSA 2040 SAN Controller |
C8R09A |
|
|||||||||||||||||||||||||||||||
|
HPE MSA 2040 SAS Controller |
C8S53A |
|
|||||||||||||||||||||||||||||||
|
|
|
|
|||||||||||||||||||||||||||||||
|
SFF Carrier-grade (only) DC-power JBOD |
|
|
|||||||||||||||||||||||||||||||
|
HPE MSA Dual I/O DC Power Carrier Grade SFF (2.5in) Drive Enclosure NOTE: 24-drive SFF bays, NEBS certified, only sold with carrier-grade arrays. |
BV921C |
|
|||||||||||||||||||||||||||||||
|
HPE MSA SFF Hard Disk Drives |
|
|
|||||||||||||||||||||||||||||||
|
MSA 2040 Drives: |
|
|
|||||||||||||||||||||||||||||||
|
|
|
|
|||||||||||||||||||||||||||||||
|
SAS Drives (SFF 2.5-inch) |
|
|
|||||||||||||||||||||||||||||||
|
12G SFF 15K SAS HDDs |
|
|
|||||||||||||||||||||||||||||||
|
HPE MSA 300GB 12G SAS 15K SFF (2.5in) Enterprise 3yr Warranty Hard Drive |
J9F40A |
|
|||||||||||||||||||||||||||||||
|
HPE MSA 600GB 12G SAS 15K SFF (2.5in) Enterprise 3yr Warranty Hard Drive |
J9F42A |
|
|||||||||||||||||||||||||||||||
|
HPE MSA 900GB 12G SAS 15K SFF (2.5in) Enterprise 3yr Warranty Hard Drive |
Q1H47A |
|
|||||||||||||||||||||||||||||||
|
12G SFF 10K SAS HDDs |
|
|
|||||||||||||||||||||||||||||||
|
HPE MSA 300GB 12G SAS 10K SFF(2.5in) Dual Port Enterprise 3yr Warranty Hard Drive |
J9F44A |
|
|||||||||||||||||||||||||||||||
|
HPE MSA 600GB 12G SAS 10K SFF(2.5in) Dual Port Enterprise 3yr Warranty Hard Drive |
J9F46A |
|
|||||||||||||||||||||||||||||||
|
HPE MSA 1.2TB 12G SAS 10K SFF(2.5in) Dual Port Enterprise 3yr Warranty Hard Drive |
J9F48A |
|
|||||||||||||||||||||||||||||||
|
12G SFF SAS SSDs (Mixed Use) |
|
|
|||||||||||||||||||||||||||||||
|
HPE MSA 400GB 12G SAS Mixed Use SFF (2.5in) 3yr Warranty Solid State Drive |
N9X95A |
|
|||||||||||||||||||||||||||||||
|
HPE MSA 800GB 12G SAS Mixed Use SFF (2.5in) 3yr Warranty Solid State Drive |
N9X96A |
|
|||||||||||||||||||||||||||||||
|
HPE MSA 1.6TB 12G SAS Mixed Use SFF (2.5in) 3yr Warranty Solid State Drive |
N9X91A |
|
|||||||||||||||||||||||||||||||
|
HPE MSA 3.2TB 12G SAS Mixed Use SFF (2.5in) 3yr Warranty Solid State Drive |
N9X92A |
|
|||||||||||||||||||||||||||||||
|
|
12G SFF SAS SED |
|
|
||||||||||||||||||||||||||||||
|
HPE MSA 1.2TB 12G SAS 10K SFF (2.5in) Enterprise Self Encrypted 3yr Wty Hard Drive |
P9M81A |
|
|||||||||||||||||||||||||||||||
|
|
|
|
|
||||||||||||||||||||||||||||||
|
Smart Buys |
SmartBuys are pre-discounted SKU’s available in participating North and South American countries. Please check with your local authorized partner for availability |
|
|
||||||||||||||||||||||||||||||
|
|
|
|
|
||||||||||||||||||||||||||||||
|
|
Smart Buy Drive Kits |
|
|
||||||||||||||||||||||||||||||
|
|
HPE MSA 300GB 12G SAS 10K SFF(2.5in) Dual Port Enterprise 3yr Warranty Hard Drive/S-Buy |
J9F44SB |
|
||||||||||||||||||||||||||||||
|
|
HPE MSA 600GB 12G SAS 10K SFF(2.5in) Dual Port Enterprise 3yr Warranty Hard Drive/S-Buy |
J9F46SB |
|
||||||||||||||||||||||||||||||
|
|
HPE MSA 1.2TB 12G SAS 10K SFF(2.5in) Dual Port Enterprise 3yr Warranty Hard Drive/S-Buy |
J9F48SB |
|
||||||||||||||||||||||||||||||
|
|
HPE MSA 1.8TB 12G SAS 10K SFF (2.5in) 512e Enterprise 3yr Warranty Hard Drive/S-Buy |
J9F49SB |
|
||||||||||||||||||||||||||||||
|
|
|
|
|
||||||||||||||||||||||||||||||
|
|
Smart Buy MSA 2040 Storage Systems |
|
|
||||||||||||||||||||||||||||||
|
|
HPE MSA 2040 SAN Controller/S-Buy |
C8R09SB |
|
||||||||||||||||||||||||||||||
|
|
HPE MSA 2040 8Gb Short Wave Fibre Channel SFP+ 4-pack Transceiver/S-Buy |
C8R23SB |
|
||||||||||||||||||||||||||||||
|
|
HPE MSA 2040 16Gb Short Wave Fibre Channel SFP+ 4-pack Transceiver/S-Buy |
C8R24SB |
|
||||||||||||||||||||||||||||||
|
|
HPE MSA 2040 1Gb Short Wave iSCSI SFP+ 4-pack Transceiver/S-Buy |
C8S75SB |
|
||||||||||||||||||||||||||||||
|
|
HPE MSA 2040 10Gb Short Wave iSCSI SFP+ 4-pack Transceiver/S-Buy |
C8R25SB |
|
||||||||||||||||||||||||||||||
|
|
HPE MSA 2040 Energy Star SAN Dual Controller LFF Storage/S-Buy |
K2R79SB |
|
||||||||||||||||||||||||||||||
|
|
HPE MSA 2040 Energy Star SAN Dual Controller SFF Storage/S-Buy |
K2R80SB |
|
||||||||||||||||||||||||||||||
|
|
HPE MSA 2040 Energy Star SFF Chassis/S-Buy |
K2R81SB |
|
||||||||||||||||||||||||||||||
|
|
HPE MSA 2040 Energy Star LFF Chassis/S-Buy |
K2R82SB |
|
||||||||||||||||||||||||||||||
|
|
HPE MSA 2040 Energy Star SAS Dual Controller LFF Storage/S-Buy |
K2R83SB |
|
||||||||||||||||||||||||||||||
|
|
HPE MSA 2040 Energy Star SAS Dual Controller SFF Storage/S-Buy |
K2R84SB |
|
||||||||||||||||||||||||||||||
|
|
HPE MSA 2040 Energy Star LFF Disk Enclosure/S-Buy |
M0S96SB |
|
||||||||||||||||||||||||||||||
|
|
|
|
|
||||||||||||||||||||||||||||||
|
|
HPE MSA ES Dual Controller SAS 800GB Flash Bundle/S-Buy |
P9H23SB |
|
||||||||||||||||||||||||||||||
|
|
*Includes: (1) HP MSA 2040 ES SAS DC SFF Storage K2R84A (4) HPE MSA 800GB 12G Mixed Use SAS 2.5in SSD N9X96A (1) HPE MSA 2040 Perf Auto Tiering E-LTU D4T79A |
|
|
||||||||||||||||||||||||||||||
|
|
HPE MSA ES Dual Controller SAN 400GB Flash Bundle/S-Buy |
P9H24SB |
|
||||||||||||||||||||||||||||||
|
|
*Includes: (1) HP MSA 2040 ES SAN DC SFF Storage K2R80A |
|
|
||||||||||||||||||||||||||||||
|
|
(4) HPE MSA 400GB 12G Mixed Use SAS 2.5in SSD N9X95A (1) HPE MSA 2040 Perf Auto Tiering E-LTU D4T79A |
|
|
||||||||||||||||||||||||||||||
|
|
HPE MSA ES Dual Controller SAN 800GB Flash Bundle/S-Buy |
P9H25SB |
|
||||||||||||||||||||||||||||||
|
|
*Includes: (1) HP MSA 2040 ES SAN DC SFF Storage K2R80A |
|
|
||||||||||||||||||||||||||||||
|
|
(4) HPE MSA 800GB 12G Mixed Use SAS 2.5in SSD N9X96A (1) HPE MSA 2040 Perf Auto Tiering E-LTU D4T79A |
|
|
||||||||||||||||||||||||||||||
|
|
HPE MSA ES Dual Controller SAS 400GB Flash Bundle/S-Buy |
P9H26SB |
|
||||||||||||||||||||||||||||||
|
|
*Includes: (1) HP MSA 2040 ES SAS DC SFF Storage K2R84A (4) HPE MSA 400GB 12G Mixed Use SAS 2.5in SSD N9X95A (1) HPE MSA 2040 Perf Auto Tiering E-LTU D4T79A |
|
|
||||||||||||||||||||||||||||||
|
|
|
|
|
||||||||||||||||||||||||||||||
|
|
Smart Buy Disk Enclosures |
|
|
||||||||||||||||||||||||||||||
|
|
HP D2700 Disk Enclosure/S-Buy |
AJ941SB |
|
||||||||||||||||||||||||||||||
|
All MSA 2040 models offer a common set of valuable features: |
|||||||||||||||||||||||||||||||||||||||||||||||||||||||||||||||||||||||||||||||||||||||||||||||||||||||||||
- Four host ports per controller ú MSA 2040 SAN controller supports 8 GB FC, 16 GB FC, 1GbE iSCSI or 10GbE iSCSI SFPs. ú MSA 2040 SAS controller supports 6 GB and 12 GB SAS host connectivity using mini-SAS HD Cables. - 4 GB transportable read/write cache per controller. - Battery-free cache backup with super capacitors and compact flash
|
|||||||||||||||||||||||||||||||||||||||||||||||||||||||||||||||||||||||||||||||||||||||||||||||||||||||||||
|
All MSA 2040 models offer a common set of valuable features: |
|
|
NOTE: Customers must upgrade their MSA 2040 controller firmware to GL200 or later for MSA virtualizations features Customers must upgrade their MSA 2040 controller firmware to GL210 or later for enhanced performance Customers must upgrade their MSA 2040 controller firmware to GL220 or later for additional MSA virtualization features (such as remote snap replication for iSCSI, virtual tier affinity, large pool support, snapshot space management, scheduler and volume copy on virtual storage)
|
|
|
Application Solutions |
The HPE MSA 2040 Storage is the ideal solution for customers running Oracle, Microsoft, SAP environments and those customers who are deploying virtual server technologies like VMware and Hyper-V. The MSA 2040 delivers enterprise functionality that enhances virtual environments, simplifies management, and reduces costs. Easy to deploy, scale and maintain, HPE MSA 2040 Arrays ensure that crucial business data remains available.
|
Family Information
|
|
MSA 2040 |
|
Capacity |
LFF: |
|
Pool Capacity |
GL200: 169 TB (154 TiB) GL210: 219 TB (200 TiB) GL220: 329 TB (300 TiB) GL220 with Large Pool Support: 562 TB (512 TiB) NOTE: 1) The above pool capacities by firmware release apply to virtual storage only 2) The above capacities are usable capacity/pool. Each MSA system can support two pools. Therefore each MSA storage system can have double the usable capacity listed above |
|
Cache |
6 GB per controller NOTE: 6GB cache includes Data (Read/Write) cache = 4GB and Metadata and System OS memory= 2GB |
|
Total LUNs |
512 Thin Provisioning allows you to create the LUNs independent of the physical storage |
|
Host Interconnect |
MSA 2040 SAN controller will support up to four connections with options of 16Gb, 8Gb FC and 10GbE, 1GbE iSCSI per controller. See table above for valid configuration table. |
|
Maximum Drives |
96 LFF/199 SFF |
|
Maximum host supported |
64 in v2 UI 512 in v3 UI |
|
Standard Software: |
Snapshot, 64 (snaps) |
|
Optional Software |
Remote Snap (linear storage only) Performance Tiering |
|
|
|||||||||||||||||||||||||||||||||||||||||||||||||||||||||||||||||||||||||||||||||||||||||||||||||||||||||||||||||||||||||||||||||||||||||||||||||||||||||||||||||||||||||||||||||||||||||||||||||||||||||||||||||||||||||||||||||||||||||||||||||||||||||||||||||||||||||||||||||||||||||||||||||||||||||||||||||||||||||||||||||||||||||||||||||||||||||||||||||||||||||||||||||||||||||||||||||||||||||||||||||||||||||||||||||||||||||||||||||||||||||||||||||||||||||||||||||
|
Product Technology |
|||||||||||||||||||||||||||||||||||||||||||||||||||||||||||||||||||||||||||||||||||||||||||||||||||||||||||||||||||||||||||||||||||||||||||||||||||||||||||||||||||||||||||||||||||||||||||||||||||||||||||||||||||||||||||||||||||||||||||||||||||||||||||||||||||||||||||||||||||||||||||||||||||||||||||||||||||||||||||||||||||||||||||||||||||||||||||||||||||||||||||||||||||||||||||||||||||||||||||||||||||||||||||||||||||||||||||||||||||||||||||||||||||||||||||||||||
|
MSA 2040 SAN controller |
MSA 2040 SAN controller supports 8Gb FC, 16Gb FC, 1GbE iSCSI or 10GbE iSCSI SFPs. |
||||||||||||||||||||||||||||||||||||||||||||||||||||||||||||||||||||||||||||||||||||||||||||||||||||||||||||||||||||||||||||||||||||||||||||||||||||||||||||||||||||||||||||||||||||||||||||||||||||||||||||||||||||||||||||||||||||||||||||||||||||||||||||||||||||||||||||||||||||||||||||||||||||||||||||||||||||||||||||||||||||||||||||||||||||||||||||||||||||||||||||||||||||||||||||||||||||||||||||||||||||||||||||||||||||||||||||||||||||||||||||||||||||||||||||||||
|
MSA 2040 SAS controller |
MSA 2040 SAS controller supports 6Gb and 12Gb SAS host connectivity using mini-SAS HD cables. |
||||||||||||||||||||||||||||||||||||||||||||||||||||||||||||||||||||||||||||||||||||||||||||||||||||||||||||||||||||||||||||||||||||||||||||||||||||||||||||||||||||||||||||||||||||||||||||||||||||||||||||||||||||||||||||||||||||||||||||||||||||||||||||||||||||||||||||||||||||||||||||||||||||||||||||||||||||||||||||||||||||||||||||||||||||||||||||||||||||||||||||||||||||||||||||||||||||||||||||||||||||||||||||||||||||||||||||||||||||||||||||||||||||||||||||||||
|
Modular Chassis |
2U rack height. 12 Large Form Factor or 24 Small Form Factor drive bays, accommodating SSD (available only for Small Form Factor), SAS, SEDs and SAS Midline drives. Comes with space for one or two controllers |
||||||||||||||||||||||||||||||||||||||||||||||||||||||||||||||||||||||||||||||||||||||||||||||||||||||||||||||||||||||||||||||||||||||||||||||||||||||||||||||||||||||||||||||||||||||||||||||||||||||||||||||||||||||||||||||||||||||||||||||||||||||||||||||||||||||||||||||||||||||||||||||||||||||||||||||||||||||||||||||||||||||||||||||||||||||||||||||||||||||||||||||||||||||||||||||||||||||||||||||||||||||||||||||||||||||||||||||||||||||||||||||||||||||||||||||||
|
Drives available |
The MSA 2040 controllers support both the MSA 3.5-inch Large Form Factor (LFF) drives, and the MSA 2.5-inch Small Form Factor (SFF) drives.
|
||||||||||||||||||||||||||||||||||||||||||||||||||||||||||||||||||||||||||||||||||||||||||||||||||||||||||||||||||||||||||||||||||||||||||||||||||||||||||||||||||||||||||||||||||||||||||||||||||||||||||||||||||||||||||||||||||||||||||||||||||||||||||||||||||||||||||||||||||||||||||||||||||||||||||||||||||||||||||||||||||||||||||||||||||||||||||||||||||||||||||||||||||||||||||||||||||||||||||||||||||||||||||||||||||||||||||||||||||||||||||||||||||||||||||||||||
|
Optional Disk Enclosures |
Just as the user has a choice of chassis for the array head (LFF and SFF drive bays, AC or DC powered), so also do they have a choice of expansion disk enclosures accommodating either drive size. The LFF and the SFF disk enclosures can be hot-added to an operating array. SFF and LFF Array heads and Disk Enclosures can be mixed without limitations. The MSA 2040 storage systems have supported various SFF and LFF disk enclosures over time. The latest disk enclosures to be supported on the MSA 2040 platform are the MSA 2050 SFF Disk Enclosure and the MSA 2050 LFF Disk Enclosures. The MSA 2050 SFF and LFF enclosures can be added to existing MSA 2040 storage systems for expansion disk capacity. The MSA 2050 SFF and LFF disk enclosures can be intermixed with the D2700 SFF disk enclosure and/or the MSA 2040 LFF disk enclosure. The MSA 2050 SFF and LFF disk enclosures are the recommended enclosures to be used for capacity expansion on the MSA 2040 storage system. |
||||||||||||||||||||||||||||||||||||||||||||||||||||||||||||||||||||||||||||||||||||||||||||||||||||||||||||||||||||||||||||||||||||||||||||||||||||||||||||||||||||||||||||||||||||||||||||||||||||||||||||||||||||||||||||||||||||||||||||||||||||||||||||||||||||||||||||||||||||||||||||||||||||||||||||||||||||||||||||||||||||||||||||||||||||||||||||||||||||||||||||||||||||||||||||||||||||||||||||||||||||||||||||||||||||||||||||||||||||||||||||||||||||||||||||||||
|
LFF Disk Enclosures MSA 2040 3.5-inch Disk Enclosure. This 2U unit has twelve LFF (3.5-inch) drive bays and accepts for MSA dual-ported SAS, SEDs and SAS MDL drives. The pre-configured HPE MSA 2040 LFF Drive Enclosure (M0S96A) has two I/O modules and supports both single and dual controller arrays.
MSA 2050 LFF Disk Enclosure. This 2U enclosure is designed to support twelve HPE Storage LFF drives and accepts MSA dual-ported 12Gb SSD and SAS Midline hard drives. The pre-configured MSA 2050 LFF Disk Enclosure (Q1J06A) has two I/O modules and supports the MSA 2040 dual controller arrays. · The MSA 2050 LFF Disk Enclosure can be attached to the MSA 2040 LFF or SFF storage models. · Each MSA 2050 LFF Disk Enclosure ships standard with two .5m mini-SAS to mini-SAS cables for connection to the MSA 2040 array expansion port or existing disk enclosure cascade port. · LFF and/or SFF Disk Enclosures can be mixed up to the maximum of 7 total Disk Enclosures on the MSA 2040 storage models. · Requires GL225 array controller firmware or newer · The MSA 2050 LFF Disk Enclosures are the recommended LFF enclosures to be used for capacity expansion on the MSA 2040 storage system. |
|||||||||||||||||||||||||||||||||||||||||||||||||||||||||||||||||||||||||||||||||||||||||||||||||||||||||||||||||||||||||||||||||||||||||||||||||||||||||||||||||||||||||||||||||||||||||||||||||||||||||||||||||||||||||||||||||||||||||||||||||||||||||||||||||||||||||||||||||||||||||||||||||||||||||||||||||||||||||||||||||||||||||||||||||||||||||||||||||||||||||||||||||||||||||||||||||||||||||||||||||||||||||||||||||||||||||||||||||||||||||||||||||||||||||||||||||
|
SFF Disk Enclosures HP D2700 Disk Enclosure (AJ941A) is designed to support twenty five HPE Storage or ProLiant 2.5-inch Universal form factor (SFF) 12Gb, SSD, SAS, SEDs or SAS MDL hard drives. It ships standard with dual I/O modules installed.
· LFF and/or SFF Disk Enclosures can be mixed up to the maximum of 7 total Disk Enclosures. · The MSA 2040 does not support SFF SATA HDDs. HPE MSA 2050 SFF Disk Enclosure This 2U enclosure is designed to support twenty four HPE Storage 2.5-inch SFF drive bays and accepts MSA dual ported 12Gb SSD, Enterprise SAS, or SAS Midline hard drives. The pre-configured MSA 2050 SFF Disk Enclosure has two I/O modules and supports the MSA 2040 dual controller arrays. · The MSA 2050 SFF Disk Enclosure can be attached to the MSA 2040 LFF or SFF storage models · Each MSA 2050 SFF Disk Enclosure ships standard with a two .5m mini-SAS to mini-SAS cables for connection to the MSA 2040 array expansion port or existing disk enclosure cascade port. · LFF and/or SFF Disk Enclosures can be mixed up to the maximum of 7 total Disk Enclosures. · Requires GL225 array controller firmware or newer · The MSA 2050 SFF Disk Enclosures are the recommended SFF enclosures to be used for capacity expansion on the MSA 2040 storage system |
|||||||||||||||||||||||||||||||||||||||||||||||||||||||||||||||||||||||||||||||||||||||||||||||||||||||||||||||||||||||||||||||||||||||||||||||||||||||||||||||||||||||||||||||||||||||||||||||||||||||||||||||||||||||||||||||||||||||||||||||||||||||||||||||||||||||||||||||||||||||||||||||||||||||||||||||||||||||||||||||||||||||||||||||||||||||||||||||||||||||||||||||||||||||||||||||||||||||||||||||||||||||||||||||||||||||||||||||||||||||||||||||||||||||||||||||||
|
Scalability |
The MSA 2040 array configurations are designed to allow an installation to begin with smaller capacity and be able to grow gradually as needed. The flexibility of SSD, SAS or SAS MDL drives technology, form factors, sizes, speeds, and costs per GB allows a system to easily fit in almost any budget.
|
||||||||||||||||||||||||||||||||||||||||||||||||||||||||||||||||||||||||||||||||||||||||||||||||||||||||||||||||||||||||||||||||||||||||||||||||||||||||||||||||||||||||||||||||||||||||||||||||||||||||||||||||||||||||||||||||||||||||||||||||||||||||||||||||||||||||||||||||||||||||||||||||||||||||||||||||||||||||||||||||||||||||||||||||||||||||||||||||||||||||||||||||||||||||||||||||||||||||||||||||||||||||||||||||||||||||||||||||||||||||||||||||||||||||||||||||
|
Vdisks |
The Vdisk nomenclature is being replaced by Disk Group. In the Linear Storage and in the SMU V2 you will see reference to Vdisk in Linear Storage and the SMU V3 you will see Disk Group. Vdisk and Disk Group are essentially the same. Vdisks have additional RAID types (RAID 0, 3) not available only in the CLI. |
||||||||||||||||||||||||||||||||||||||||||||||||||||||||||||||||||||||||||||||||||||||||||||||||||||||||||||||||||||||||||||||||||||||||||||||||||||||||||||||||||||||||||||||||||||||||||||||||||||||||||||||||||||||||||||||||||||||||||||||||||||||||||||||||||||||||||||||||||||||||||||||||||||||||||||||||||||||||||||||||||||||||||||||||||||||||||||||||||||||||||||||||||||||||||||||||||||||||||||||||||||||||||||||||||||||||||||||||||||||||||||||||||||||||||||||||
|
Disk Group
LUNs
Storage Pools |
A Disk Group is a collection of disks in a given redundancy mode (RAID 1, 5, 6, 10, 50). It is equivalent to a Vdisk in Linear Storage and utilizes the same proven fault tolerant technology used by Linear Storage. Disk Group RAID level and size can be created based on performance and/or capacity requirements. With GL200 or newer firmware multiple Disk Groups can be allocated into a Storage Pool for use with the Virtual Storage features.
The MSA 2040 arrays support 512 volumes and up to 512 snapshots in a system. All of these volumes can be mapped to LUNs. Maximum LUN sizes up to 140TB (128 TiB), the LUNs size are dependent on the storage architecture: Linear vs. Virtualized. Thin Provisioning allows the user to create the LUNs independent of the physical storage.
The GL200 firmware or newer introduces Storage Pools – which are comprised of one or more Disk Groups. LUNs are no longer be restricted to a single Vdisk as with Linear Storage. A volume’s data on a given LUN can now span all disk drives in a pool. When capacity is added to a system, users will benefit from the performance of all spindles in that pool. Leveraging Storage Pools, the MSA 2040 supports large, flexible Volumes with sizes up to 128TiB and facilitates seamless capacity expansion. As volumes are expanded data automatically reflows to balance capacity utilization on all drives. |
||||||||||||||||||||||||||||||||||||||||||||||||||||||||||||||||||||||||||||||||||||||||||||||||||||||||||||||||||||||||||||||||||||||||||||||||||||||||||||||||||||||||||||||||||||||||||||||||||||||||||||||||||||||||||||||||||||||||||||||||||||||||||||||||||||||||||||||||||||||||||||||||||||||||||||||||||||||||||||||||||||||||||||||||||||||||||||||||||||||||||||||||||||||||||||||||||||||||||||||||||||||||||||||||||||||||||||||||||||||||||||||||||||||||||||||||
|
RAID 0, 1, 3, 5, 6, 10, 50 |
In addition to the usual RAID levels, the MSA 2040 features several important additional levels. RAID 6 offers the highest level of RAID protection. It allocates two sets of parity data across drives and allows simultaneous write operations. It can withstand two simultaneous drive failures without downtime or data loss. RAID 10 is mirroring and striping without parity and allows large Disk Groups to be created with high performance and mirroring for fault tolerance. RAID 50 combines the block striping and parity of RAID 5 with the straight block striping of RAID 0, yielding higher performance than RAID 5 through the addition of RAID 0, particularly during writes. |
||||||||||||||||||||||||||||||||||||||||||||||||||||||||||||||||||||||||||||||||||||||||||||||||||||||||||||||||||||||||||||||||||||||||||||||||||||||||||||||||||||||||||||||||||||||||||||||||||||||||||||||||||||||||||||||||||||||||||||||||||||||||||||||||||||||||||||||||||||||||||||||||||||||||||||||||||||||||||||||||||||||||||||||||||||||||||||||||||||||||||||||||||||||||||||||||||||||||||||||||||||||||||||||||||||||||||||||||||||||||||||||||||||||||||||||||
|
Performance |
The performance figures provided here are for reference as many variables exist between array configurations, workloads, hard drive types, disk group setup parameters and host system setup. All performance information is measured using both Linear and Virtual Storage
|
||||||||||||||||||||||||||||||||||||||||||||||||||||||||||||||||||||||||||||||||||||||||||||||||||||||||||||||||||||||||||||||||||||||||||||||||||||||||||||||||||||||||||||||||||||||||||||||||||||||||||||||||||||||||||||||||||||||||||||||||||||||||||||||||||||||||||||||||||||||||||||||||||||||||||||||||||||||||||||||||||||||||||||||||||||||||||||||||||||||||||||||||||||||||||||||||||||||||||||||||||||||||||||||||||||||||||||||||||||||||||||||||||||||||||||||||
|
MSA 2040 Array Performance 1 |
HPE MSA 2040 |
HPE MSA 2040 |
HPE MSA 2040 |
|
Protocol (host connect) |
16 Gb Fibre Channel |
16 Gb Fibre Channel |
16 Gb Fibre Channel |
|
MSA 2040 RAID 10 Performance Results 2 |
|||
|
Random Reads (IOPs) |
66,000 |
|
|
|
Random Writes (IOPs) |
32,000 |
|
|
|
MSA 2040 RAID 1 SSD Performance Results 3 |
|||
|
Random Reads (IOPs) |
|
122,000 |
115,000 |
|
Random Writes (IOPs) |
|
43,000 |
40,000 |
|
MSA 2040 RAID 5 Performance Results 4 |
|||
|
Sequential Reads (MB/s) |
6,300 |
|
|
|
Sequential Writes (MB/s) |
5,200 |
|
|
|
Benchmark Setup Configurations |
|||
|
1 Performance numbers generated through the IO Meter performance software. |
|||
|
2 Dual Controller configuration, (192) 15k HDDs, RAID: 10, 6 drives per vDisk, block size: 8k, Average Latency under 30ms, Windows Server 2012 host, 16Gb FC direct connect to array. Tested with GL210 firmware. |
|||
|
3 Dual Controller configuration, (4) SSDs, RAID: 1, 2 drives per vDisk, block size: 8k (8k Aligned), Average Latency under 3ms, Windows Server 2012 R2 host, 16Gb FC direct connect to array. Tested with GL220 firmware. |
|||
|
4 Dual Controller configuration, (48) 15k HDD, RAID: 5, 12 drives per vDisk, block size: 256k, Average Latency under 30ms, Windows Server 2012 host, 16Gb FC direct connect to array. Sequential numbers are obtained using a single volume per vdisk and single sequential workload. Tested with GL210 firmware. |
|||
End-to-End Performance Figures using Linear Storage:
Guarantee Performance numbers are a guideline as established by tests using RAW I/O in an Operating System Agnostic test lab environment.
|
HPE MSA Linear End-to-End Performance Figures5 |
||||||||
|
MSA 2040 Array Performance |
HPE MSA 2040 |
HPE MSA 2040 |
HPE MSA 2040 |
HPE MSA 2040 |
HPE MSA 2040 |
HPE MSA 2040 |
HPE MSA 2040 |
HPE MSA 2040 |
|
Protocol (host connect)6 |
16 Gb |
16 Gb |
10GbE |
10GbE |
1GbE |
1GbE |
12Gb |
12Gb |
|
MSA 2040 RAID 10 Performance Results **NOTE: RAID 1 was used for SSD testing |
||||||||
|
Random Reads |
57,000 |
112,500 |
56,500 |
102,000 |
56,500 |
93,000 |
56,500 |
112,500 |
|
Random Writes |
32,000 |
31,500 |
30,500 |
31,500 |
30,500 |
31,500 |
31,000 |
32,500 |
|
Random Mix 60/40 |
45,000 |
57,500 |
44,500 |
54,500 |
44,500 |
54,500 |
44,500 |
58,000 |
|
Sequential Reads |
5,000 |
|
4,700 |
|
860 |
|
4,720 |
|
|
Sequential Writes |
2,400 |
|
2,300 |
|
850 |
|
2,300 |
|
|
MSA 2040 RAID 5 Performance Results **NOTE: RAID 1 was used for SSD testing |
||||||||
|
Random Reads |
57,000 |
106,500 |
55,500 |
100,000 |
55,500 |
87,000 |
55,500 |
108,000 |
|
Random Writes |
18,000 |
20,500 |
17,500 |
20,500 |
17,500 |
20,000 |
18,000 |
20,500 |
|
Random Mix 60/40 |
30,000 |
37,500 |
29,500 |
37,500 |
29,500 |
36,500 |
29,500 |
37,000 |
|
Sequential Reads |
4,900 |
|
4,700 |
|
860 |
|
4,700 |
|
|
Sequential Writes |
4,000 |
|
3,600 |
|
850 |
|
4,100 |
|
|
MSA 2040 RAID 6 Performance Results **NOTE: RAID 1 was used for SSD testing |
||||||||
|
Random Reads |
57,000 |
106,500 |
54,500 |
97,500 |
54,500 |
87,000 |
55,500 |
108,000 |
|
Random Writes |
12,500 |
16,500 |
12,000 |
16,000 |
12,000 |
16,000 |
12,500 |
16,500 |
|
Random Mix 60/40 |
23,000 |
31,500 |
22,500 |
31,000 |
22,500 |
30,500 |
23,000 |
32,000 |
|
Sequential Reads |
4,900 |
|
4,600 |
|
860 |
|
4,500 |
|
|
Sequential Writes |
3,900 |
|
3,500 |
|
850 |
|
3,800 |
|
|
Refer to the paper titled "Upgrading to the HPE MSA 2040", available in the Resource Library at: http://www.hpe.com/storage/msa2040 |
||||||||
5) Sequential tests (MB/s) are based on 256K block sizes and random tests (IOPS) are based on 8K block sizes run against linear storage. For sequential workloads with a queue depth greater than 1, each sequential stream is targeted to operate on a separate LBA range. Other types of sequential workloads that target specific LBA ranges may achieve higher results. Results cannot be expected with a single host.
6) Fibre Channel results were measured using 16Gb FC Host Bus Adapters. SAS results were measured using 6Gb SAS Host Bus Adapters. 10GbE iSCSI results were measured using 10GbE iSCSI Host Bus Adapters. 1GbE iSCSI results were measured using 1GbE network interface controllers (NICs). Hosts were directly attached to the HPE MSA 2040 array.
7). MSA 2040 Hard Disk Drive (HDD) results: Dual Controller configuration, 192 15k SAS HDDs, 12 drives per vdisk, 8 vdisks per controller, 1 volume per vdisk.
8). MSA 2040 Solid State Drives (SSD) results: Dual Controller configuration, 2 SSDs per vdisk in RAID 1, 3 SSDs per vdisk in RAID 5, 4 SSDs per vdisk in RAID6, 2 vdisks per controller, 1 volume per vdisk
NOTE: Number and type of applications, drive type and number of drives, operating system used, and the number of hosts will affect overall performance. This table is provided strictly as a test-lab comparison.
End-to-End Performance Figures using Virtual Storage:
Guarantee Performance numbers are a guideline as established by tests using RAW I/O in an Operating System Agnostic test lab environment.
|
HPE MSA Virtual End-to-End Performance Figures9 |
||||||||
|
MSA 2040 Array Performance |
HPE MSA 2040 |
HPE MSA 2040 |
HPE MSA 2040 |
HPE MSA 2040 |
HPE MSA 2040 |
HPE MSA 2040 |
HPE MSA 2040 |
HPE MSA 2040 |
|
Protocol (host connect)10 |
16 Gb |
16 Gb |
10GbE |
10GbE |
1GbE |
1GbE |
12Gb |
12Gb |
|
MSA 2040 RAID 10 Performance Results 11,12,13,18** NOTE: RAID 1 was used for SSD testing |
||||||||
|
Random Reads |
62,300 |
96,000 |
62,000 |
92,500 |
61,100 |
81,500 |
62,700 |
92,900 |
|
Random Writes |
33,100 |
40,500 |
32,200 |
38,300 |
31,700 |
37,500 |
32,400 |
39,000 |
|
Random Mix 60/40 |
44,800 |
58,100 |
44,200 |
55,700 |
43,400 |
53,900 |
44,100 |
56,300 |
|
Sequential Reads |
5,350 |
|
5,340 |
|
880 |
|
5,350 |
|
|
Sequential Writes |
3,110 |
|
2,910 |
|
860 |
|
3,110 |
|
|
MSA 2040 RAID 5 Performance Results 14,15,18** |
||||||||
|
Random Reads |
54,300 |
92,300 |
53,300 |
83,200 |
52,900 |
70,470 |
54,000 |
88,800 |
|
Random Writes |
17,700 |
22,500 |
17,500 |
22,100 |
17,500 |
21,800 |
17,700 |
22,200 |
|
Random Mix 60/40 |
27,200 |
38,900 |
27,000 |
38,000 |
27,000 |
37,500 |
27,300 |
38,400 |
|
Sequential Reads |
5,270 |
|
5,250 |
|
880 |
|
5,270 |
|
|
Sequential Writes |
3,950 |
|
3,430 |
|
880 |
|
3,900 |
|
|
MSA 2040 RAID 6 Performance Results 16,17,18 |
||||||||
|
Random Reads |
55,100 |
93,000 |
54,100 |
79,000 |
53,800 |
70,470 |
55,000 |
89,800 |
|
Random Writes |
13,000 |
19,200 |
13,000 |
18,800 |
13,000 |
18,700 |
13,000 |
19,000 |
|
Random Mix 60/40 |
21,100 |
34,800 |
21,000 |
33,800 |
21,100 |
33,600 |
21,000 |
34,200 |
|
Sequential Reads |
5,540 |
|
5,480 |
|
880 |
|
5,530 |
|
|
Sequential Writes |
3,790 |
|
3,290 |
|
880 |
|
3,810 |
|
|
Refer to the paper titled "Upgrading to the HPE MSA 2040", available in the Resource Library at: http://www.hpe.com/storage/msa2040 |
||||||||
9) Sequential tests (MB/s) are based on 256K block sizes and random tests (IOPS) are based on 8K block sizes run against virtual pool storage. For sequential workloads with a queue depth greater than 1, each sequential stream is targeted to operate on a separate LBA range. Other types of sequential workloads that target specific LBA ranges may achieve higher results. Results cannot be expected with a single host.
10) Fibre Channel results were measured using 16Gb FC Host Bus Adapters. SAS results were measured using 6Gb SAS Host Bus Adapters. 10GbE iSCSI results were measured using 10GbE iSCSI Host Bus Adapters. 1GbE iSCSI results were measured using 1GbE network interface controllers (NICs). Hosts were directly attached to the HPE MSA 2040 array.
11) MSA 2040 RAID 10 Hard Disk Drive (HDD) random results: Dual Controller configuration, 192 15k SAS HDDs, 12 drives per disk group, 8 disk groups per pool, 8 volumes per pool.
12) MSA 2040 RAID 10 Hard Disk Drive (HDD) sequential read results: Dual Controller configuration, 96 15k SAS HDDs, 12 drives per disk group, 4 disk groups per pool, 4 volumes per pool.
13) MSA 2040 RAID 10 Hard Disk Drive (HDD) sequential write results: Dual Controller configuration, 48 15k SAS HDDs, 12 drives per disk group, 2 disk groups per pool, 4 volumes per pool.
14) MSA 2040 RAID 5 Hard Disk Drive (HDD) random results: Dual Controller configuration, 180 15k SAS HDDs, 9 drives per disk group, 10 disk groups per pool, 10 volumes per pool.
15) MSA 2040 RAID 5 Hard Disk Drive (HDD) sequential results: Dual Controller configuration, 72 15k SAS HDDs, 9 drives per disk group, 4 disk groups per pool, 4 volumes per pool.
16) MSA 2040 RAID 6 Hard Disk Drive (HDD) random results: Dual Controller configuration, 180 15k SAS HDDs, 10 drives per disk group, 9 disk groups per pool, 9 volumes per pool.
17) MSA 2040 RAID 6 Hard Disk Drive (HDD) sequential results: Dual Controller configuration, 80 15k SAS HDDs, 10 drives per disk group, 4 disk groups per pool, 4 volumes per pool.
18) MSA 2040 Solid State Drives (SSD) results: Dual Controller configuration, 2 SSDs per disk group in RAID 1, 3 SSDs per disk group in RAID 5, 4 SSDs per disk group in RAID6, 1 disk group per pool, 1 volume per pool.
NOTE: Number and type of applications, drive type and number of drives, operating system used, and the number of hosts will affect overall performance. This table is provided strictly as a test-lab comparison
|
DC-power chassis |
Hewlett Packard Enterprise is making the two models of controller-less chassis available with direct current (DC) power supplies. They each have the two empty bays where users can insert one or two MSA 2040 controller(s). |
|
|
MSA 2040 Controller-less Chassis (DC-powered) |
|
|
|
HPE MSA 2040 SFF DC-power Chassis |
C8R11A |
|
|
(Will accept one or two MSA 2040 SAN or MSA 2040 SAS controllers and can accommodate up to twenty four 2.5-in (SFF) drives) |
|
|
|
HPE MSA 2040 LFF DC-power Chassis |
C8R13A |
|
|
(Will accept one or two MSA 2040 SAN or MSA 2040 SAS controllers and can accommodate up to twelve 3.5-in (LFF) drives) |
|
|
|
Configuration and Management Tools |
HPE Storage Management Utility (SMU). Management access, out-of-band: WEB GUI, CLI. Interface Types: USB 100/1000 Ethernet. Protocols Supported SNMP, SMI-S, SSL, SSH, SMTP, FTP, HTTP, Telnet |
|
|
MSA 2040 Software and Documents |
|
|
|
Hot Plug Expansion and Replacement Support |
All MSA 2040 models support hot plug expansion and replacement of redundant controllers, enclosures, fans, power supplies, and I/O modules for simple, fast installation and maintenance. Hot add expansion of disk enclosures is also supported. |
|
|
Snapshot and Clone |
All MSA 2040 arrays come standard with 64 snaps, 512 snaps is available as an option. This controller based functionality offers higher levels of data protection, enables an almost instant recovery from data failure or corruption and offers alternative development testing of 'offline' production data and the ability to backup snapped/cloned data. |
|
|
Overview |
The MSA 2040 arrays come integrated with web browser and CLI based software for storage and RAID management, setup, configuration, and troubleshooting. This reduces the cost of ownership by reducing the training and technical expertise necessary to install and maintain your HPE storage solution. |
|
|
Server Compatibility |
Supports most HPE ProLiant, BladeSystems and Integrity servers including
|
|
|
Industry Standard servers support |
|
|
|
OS Support |
Refer to the Hewlett Packard Enterprise support statements for complete current OS version support: http://www.hpe.com/storage/spock
|
|
|
Web Browser support |
|
|
Optional Software
|
Advanced Data Services Software Suite |
All software for the MSA platform is now included as a standard feature on the MSA 2042 at no extra charge. The MSA 2042 includes the Advanced Data Services Software Suite which includes the following software titles 1. HPE MSA 2040 Performance Automated Tiering LTU 2. HPE MSA 2040 512 Snapshot Software LTU 3. HPE MSA Remote Snap Software LTU HPE MSA Advanced Data Services Suite LTU Q0H99A HPE MSA Advanced Data Services Suite E-LTU Q0H99AAE See below for a detailed description of each of these software features. |
|
|
Performance Tiering
VMware Site Recovery Manager(SRM) |
Disk tiers are comprised of aggregating 1 or more Disk Groups of similar physical disks. The MSA 2040 supports 3 distinct tiers: 1. A Performance tier with SSDs 2. A Standard SAS tier with Enterprise SAS HDDs 3. An Archive tier utilizing Midline SAS HDDs. Prior to GL200 firmware the MSA 2040 operated through manual Tiering, LUN-level tiers are manually created and managed by using dedicated vdisks and volumes. LUN level Tiering requires careful planning such that applications requiring the highest performance be placed on Vdisks utilizing high performance SSD´s. Applications with lower performance requirements can be placed on Vdisks comprised of Enterprise SAS or midline SAS HDDs. Beginning with GL200 or newer firmware, the MSA 2040 now supports sub-LUN tiering and automated data movement between tiers. The MSA 2040 automated tiering engine moves data between available tiers based on the access characteristics of that data. Frequently accessed “pages” will migrate to the highest available tier delivering maximum I/O´s to the application (Performance Tiering). Another feature to the MSA 2040 tiering engine is Archive Tiering where “cold” or not frequently accessed data can be moved to lower performance tiers. Pages are migrated between tiers automatically such that I/O’s are optimized in real-time. The Archive Tiering functionality is provided at no charge on the MSA 2040 platform beginning with GL200 or newer firmware. The Performance Tiering capability utilizing a fault tolerant SSD Disk Group is a paid feature and requires the below SKU to enable it. Creating an SSD virtual disk group for both read and write capabilities requires a Performance Auto Tiering License. Performance Tiering from SAS MDL (Archive Tier) to Enterprise SAS (Standard Tier) drives is provided at no charge.
VMware vCenter Site Recovery Manager (SRM) is an extension to VMware vCenter that delivers business-continuity and disaster-recovery solution that helps you plan, test, and execute the recovery of vCenter virtual machines. SRM can discover and manage replicated datastores, and automate migration of inventory from one vCenter to another. Site Recovery Manager integrates with the underlying replication product through a Storage Replication Adapter (SRA). The SRM is available only for linear storage. HPE MSA 2040 Site Recovery Adapter (SRA) The MSA 2040 SRA, a free-to-use plugin, is the program that integrates the VMware vCenter SRM with HPE MSA 2040 arrays. It enables full-featured use of the VMware SRM. It is a host-software component installed on a Microsoft Windows Server that enables disaster recovery management (DRM) software on the host to communicate and control certain aspects of the replication feature in storage systems connected to the server. It allows the VMware SRM software to automatically coordinate virtual machine failover and failback between a protected data center and a disaster recovery site by employing a disaster recovery solution called Remote Snap. A perfect combination of the Remote Snap replication and VMware SRM provides an unfailing automated solution for implementing and testing the disaster recovery between sites located across geographies. It enables communication between the HPE MSA Remote Snap replication functionality that is embedded in HPE MSA 2040 systems. Users are required to acquire Remote Snap license for their local and remote HPE MSA 2040 arrays to use the HPE MSA SRA. Site Recovery Manager Requirements/Dependencies:
|
|
|
HPE OneView for VMware vCenter |
HPE OneView for VMware vCenter is a component within the HPE OneView plug-in for vCenter. It provides VMware administrators that are using VMware's vSphere management console (vCenter) with the ability to see how virtual machines are mapped to datastores and individual MSA 2040 volumes. By providing these clear relationships between VM's, datastores and storage, the VMware administrator's productivity increases, as does the ability to ensure quality of service. Roles for administrators can be defined on an individual basis, providing the ability to apply specific permissions for both view and control functions. HPE OneView for VMware vCenter supports mixed array environments including MSA 2040, 1040, P2000, EVA, P4000, and the XP array series including the P9500. When deployed with the MSA 2040 array, HPE OneView provides the following:
- Create/Expand/Delete a Datastore - Create a Virtual Machine from a template - VMClone for linear storage
HPE OneView for VMware vCenter is downloadable from Software Depot: https://h20392.www2.hpe.com/portal/swdepot/displayProductInfo.do?productNumber=HPVPR For more information on HPE OneView for VMware vCenter visit: http://h22168.www2.hpe.com/us/en/partners/vmware/ |
|
|
HPE StoreFront Manager for Microsoft |
HPE StoreFront Manager for Microsoft enables management and monitoring of HPE MSA Storage running in Microsoft Hyper-V environment with a single pane-of-glass view to events/alerts, capacity and health dashboards and detailed virtual infrastructure information. It integrates seamlessly with Microsoft System Center Operations Manager (SCOM) and provides Microsoft administrators the following:
It supports heterogeneous HPE Storage environment including MSA 2040, 1040, HPE StoreVirtual, HPE 3PAR StoreServ, HPE StoreOnce, HPE StoreEasy, HPE XP, HPE EVA and HPE StoreEver Storage.
When deployed with the MSA 2040 array, HPE StoreFront Manager provides the following: · Monitors the health, events and alerts for the MSA 2040/1040 – Linear and virtual Pools, and volumes · Provides detailed information on the VMs provisioned through MSA Storage · Effortless installation and configuration using Powershell
HPE StoreFront Manager for Microsoft for MSA Storage is downloadable from Software Depot: https://h20392.www2.hpe.com/portal/swdepot/displayProductInfo.do?productNumber=System_Center
|
|
|
vStorage API for Array Integration (VAAI) |
The vStorage API for Array Integration (VAAI) is one of the storage application programming interface (API) sets in vSphere. VAAI is an API storage partners can leverage to enhance performance of virtual machine (VM) management operations by delegating these operations to the storage array. With hardware offload, ESX/ESXi hosts perform certain operations faster and consume less server CPU and memory resources, and also storage port and storage fabric bandwidth. VAAI includes high performance and scalable VM data path primitives. Storage Hardware Primitives for VAAI
|
|
|
Snapshot and Volume Copy Software for the MSA 2040 |
Product Features |
|
|
Data Protection
|
||
|
Data Testing
|
||
|
MSA 2040 Snapshot and Clone: All MSA 2040 models come STANDARD with 64 snapshots and Volume Copy software (volume copy is available for both linear and virtual storage with GL220 firmware or later; pre-GL220 firmware volume copy is only available on linear storage). 512 Snapshot option is also available for additional cost. |
||
|
HP MSA 512-Snapshot Software LTU |
TC462A |
|
|
HP MSA 512-Snapshot Software E-LTU |
TC462AAE |
|
|
HPE MSA Remote Snap Software |
|
|
|
NOTE: One Advanced Data Services (ADS) license per array is required for replication. For example, if you have two MSA arrays performing replication (from Primary system to Remote System), you will need 2 ADS licenses. |
|
|
|
Product Features |
|
|
Warranty, Service and Support Information
|
Warranty |
Three-year limited warranty, parts exchange Next Business day delivery Enclosures, Hard drives, and Options for the MSA 2040 carry their own warranty. Refer to Hewlett Packard Enterprise Limited Warranty Statement for more information. The MSA 2040 has been designed with customer self-repairable parts to minimize repair time and provide greater flexibility in performing defective parts replacement. Please refer to Hewlett Packard Enterprise limited warranty Statement and parts replacement instructions for further details. Products included in various kits carry their own individual warranties. NOTE: The warranty of the hard drive options purchased with the MSA 2040 models is different for SAS hard drives versus SAS MDL. SAS hard drive options have a three year warranty and SAS MDL have a one year warranty. |
|
|
|
|
Solid State Drives (SSD) |
3/0/0 warranty; Customer Self Repair (CSR) subject to maximum usage and or maximum supported lifetime limitations, whichever occurs first. Maximum Supported Lifetime is the period in years set to equal the warranty for the device. Maximum usage limit is the maximum amount of data that can be written to the device before reaching the device's write endurance limit.
NOTE: SSDs used for replacement will be of equal or greater capacity and are designed to meet or exceed the original SSD warranty. Replacement drive/s could be of the same model drive or of a different model qualified to operate interchangeably inside the MSA array. Warranties of these components are unaffected by any substitution. |
|
|
|
|
Service and Support |
Protect your business beyond warranty with HPE Support Services HPE Technology Services delivers confidence, reduces risk and helps customers realize agility and stability. Our integrated portfolio of Services for storage help customers reduce costs, optimize data, streamline storage management, and improve backup and recovery. HPE Support Services enable you to choose the right service level, length of coverage and response time as you purchase your new storage solution, giving you full entitlement for the support for need for your IT and business |
|
|
|
|
Connect your devices |
Unlock all of the benefits of your technology investment by connecting your products to HP Enterprise. Achieve up to 77%1 reduction in down time, near 100%2 diagnostic accuracy and a single consolidated view of your environment. By connecting, you will receive 24x7monitoring, pre-failure alerts, automatic call logging, and automatic parts dispatch. HPE Proactive Care Service and HPE Datacenter Care Service customers will also benefit from proactive activities to help prevent issues and increase optimization. All of these benefits are already available to you with your server storage and networking products, securely connected to HPE support. 1 IDC whitepaper - The Business Value of Connected Support from HP, March 2015 2 HP CSC reports 2014 – 2015 |
|
|
|
|
Optimized Care |
HPE Proactive Care with 6 hour call-to-repair commitment, three year Support Service HPE Proactive Care gives customers an enhanced call experience plus helps preventing problems and maintains IT stability by utilizing tailored, proactive reports with recommendations and advice when your products are connected to HPE. This Service combines three years’ proactive reporting and advice with our highest level of hardware support - HPE’s 24x7, six hour hardware call-to-repair. HPE is the only leading manufacturer who makes this level of coverage available as a standard service offering for your most valuable storage systems. |
|
|
|
|
Standard Care |
HPE Proactive Care with 24x7 coverage, three year Support Service HPE Proactive Care gives customers an enhanced call experience plus helps preventing problems and maintains IT stability by utilizing personalized proactive reports with recommendations and advice when your products are connected to HPE. This Service combines three years’ proactive reporting and advice with our 24x7 coverage, four hour hardware response time when there is a problem.http://h20195.www2.hpe.com/v2/GetPDF.aspx/4AA3-8855ENW.pdf |
|
|
|
|
Basic Care |
HPE Foundation Care 24x7, three-year Support Service HPE Foundation Care 24x7 gives you access to HPE 24 hours a day, seven days a week for assistance on resolving issues. This service includes need based Hardware onsite response within four hours. Simplify your support experience and make HPE your first call to help resolve hardware or software problems. http://h20195.www2.hpe.com/V2/GetDocument.aspx?docname=4AA4-8876ENW&cc=us&lc=en |
|
|
|
|
Related Services |
Choose from a rich portfolio of services to make the most of MSA 2042 SAN Storage so you can efficiently and affordably consolidate, manage, and extract value from unstructured data. HPE Services can help you discover needs and create a plan for simplifying the environment, reducing risk, and maximizing your storage investments HPE MSA Family Disk Array Installation and Startup Service - Implement right from the start, as Hewlett Packard Enterprise experts install, test, and configure your hardware and software onsite. We deliver a tailored storage deployment properly integrated into your environment. http://h20195.www2.hpe.com/V2/GetPDF.aspx/4AA0-3048ENW.pdf
HPE Storage Data Migration Services - End-to-end data migration service providing seamless discovery, assessment, planning, and design, completely customizable to your organization's storage area network or network attached storage environment and using innovative software to help you migrate to HPE storage quickly and efficiently.
HPE Storage Efficiency Analysis - The HPE Storage Efficiency Analysis provides customers with a view of their storage infrastructure and operating environment; highlighting recommendations for improvements. The report provides extensive insight about the existing storage environment, opportunities for efficiency gains, asset aging and replacement through interaction with key decision makers
|
|
|
|
|
For more information |
http://www8.hpe.com/us/en/business-services/it-services/storage-services.html
To learn more on HPE Storage Services, please contact your Hewlett Packard Enterprise sales representative or HPE Authorized Channel Partner
|
Configuration Information
|
Configure to Order Program Information |
|||||||||||||
|
Hewlett Packard Enterprise has a very successful Configure to Order program for the MSA 2040 family The MSA 2040 models and options may or may not be factory installed in a rack with add-on controllers, switches, disk enclosures and hard drives. The MSA 2040 arrays may be integrated with ProLiant servers or as standalone storage. |
|||||||||||||
|
|
|||||||||||||
|
Step 1 - MSA 2040 - Base Configuration |
|
||||||||||||
|
Select either controller-less chassis (step 1a) or a pre-configured model (step 1b) |
|
||||||||||||
|
Step 1a: Select one chassis: |
|
||||||||||||
|
Model Name |
SKUs |
||||||||||||
|
MSA 2040 Controller-less Chassis (AC-powered) |
|
||||||||||||
|
HPE MSA 2040 Energy Star SFF Chassis |
K2R81A |
||||||||||||
|
HPE MSA 2040 Energy Star LFF Chassis |
K2R82A |
||||||||||||
|
MSA 2040 Controller-less Chassis (DC-powered) |
|
||||||||||||
|
HPE MSA 2040 SFF DC-power Chassis |
C8R11A |
||||||||||||
|
HPE MSA 2040 LFF DC-power Chassis |
C8R13A |
||||||||||||
|
|||||||||||||
|
Step 2 – Options |
|
|
|
Select each option with quantities specified.for controller-less chassis |
|
|
|
|
||
|
Step 2a - MSA 2040 Controllers |
SKUs |
|
|
Quantity |
Description with Parts Shipped: |
|
|
1 or 2 |
HP MSA 2040 SAN Controller |
C8R09A |
|
1 or 2 |
HP MSA 2040 SAS Controller |
C8S53A |
|
|
||
|
Step 2b - SFPs |
|
|
|
MSA Small Form Factor Pluggable (SFPs) Transceivers: |
|
|
|
HPE MSA 8Gb Short Wave Fibre Channel SFP+ 4-Pack Transceiver |
C8R23B |
|
|
HPE MSA 16Gb Short Wave Fibre Channel SFP+ 4-Pack Transceiver |
C8R24B |
|
|
HPE MSA 10Gb Short Range iSCSI SFP+ 4-Pack Transceiver |
C8R25B |
|
|
HPE MSA 1Gb RJ-45 iSCSI Channel SFP+ 4-Pack Transceiver |
C8S75B |
|
|
Step 2c - SSD, SAS, SED or SAS MDL Drive Options |
|
|
|
MSA 2040 Drives: |
|
|
|
Solid State Drives (SSDs) (SFF 2.5-inch) |
|
|
|
12G SFF SAS SSDs (Mixed Use) |
|
|
|
HPE MSA 400GB 12G SAS Mixed Use SFF (2.5in) 3yr Warranty Solid State Drive |
N9X95A |
|
|
HPE MSA 800GB 12G SAS Mixed Use SFF (2.5in) 3yr Warranty Solid State Drive |
N9X96A |
|
|
HPE MSA 1.6TB 12G SAS Mixed Use SFF (2.5in) 3yr Warranty Solid State Drive |
N9X91A |
|
|
HPE MSA 3.2TB 12G SAS Mixed Use SFF (2.5in) 3yr Warranty Solid State Drive |
N9X92A |
|
|
SAS Drives (SFF 2.5-inch) |
|
|
|
12G SFF 15K SAS HDDs |
|
|
|
HP MSA 300GB 12G SAS 15K SFF (2.5in) Enterprise 3yr Warranty Hard Drive |
J9F40A |
|
|
HP MSA 600GB 12G SAS 15K SFF (2.5in) Enterprise 3yr Warranty Hard Drive |
J9F42A |
|
|
HPE MSA 900GB 12G SAS 15K SFF (2.5in) Enterprise 3yr Warranty Hard Drive |
Q1H47A |
|
|
12G SFF 10K SAS HDDs |
|
|
|
HP MSA 300GB 12G SAS 10K SFF(2.5in) Dual Port Enterprise 3yr Warranty Hard Drive |
J9F44A |
|
|
HP MSA 600GB 12G SAS 10K SFF(2.5in) Dual Port Enterprise 3yr Warranty Hard Drive |
J9F46A |
|
|
HP MSA 1.2TB 12G SAS 10K SFF(2.5in) Dual Port Enterprise 3yr Warranty Hard Drive |
J9F48A |
|
|
HP MSA 1.8TB 12G SAS 10K SFF (2.5in) 512e Enterprise 3yr Warranty Hard Drive |
J9F49A |
|
|
HPE MSA 2.4TB 12G SAS 10K SFF (2.5in) Enterprise 512e 3yr Warranty Hard Drive |
Q2R41A |
|
|
NOTE: 512e drives require MSA 1040/2040 firmware version GL200P002 or newer |
|
|
|
12G SFF 7.2K SAS MDL HDDs |
|
|
|
HP MSA 1TB 12G SAS 7.2K SFF (2.5in) 512e Midline 1yr Warranty Hard Drive |
J9F50A |
|
|
HP MSA 2TB 12G SAS 7.2K SFF (2.5in) 512e Midline 1yr Warranty Hard Drive |
J9F51A |
|
|
NOTE: 512e drives require MSA 1040/2040 firmware version GL200P002 or newer |
|
|
|
MSA Large Form Factor (LFF) SAS MDL DP drives for MSA 2040 Array |
|
|
|
12G LFF 7.2K SAS Midline Drives |
|
|
|
HPE MSA 12TB 12G SAS 7.2K LFF (3.5in) Midline 512e 1yr Warranty Hard Drive |
Q2R42A |
|
|
HPE MSA 10TB 12G SAS 7.2K LFF (3.5in) Midline 512e 1yr Wty Hard Drive |
P9M82A |
|
|
HP MSA 8TB 12G SAS 7.2K LFF (3.5in) 512e Midline 1yr Warranty Hard Drive |
M0S90A |
|
|
HP MSA 6TB 12G SAS 7.2K LFF (3.5in) 512e Midline 1yr Warranty Hard Drive |
J9F43A |
|
|
HP MSA 4TB 12G SAS 7.2K LFF (3.5in) 512e Midline 1yr Warranty Hard Drive |
K2Q82A |
|
|
NOTE: 512e drives require MSA 1040/2040 firmware version GL200P002 or newer |
|
|
|
MSA Large Form Factor (LFF) SAS DP drives for MSA 2040 Array |
|
|
|
|
|
12G LFF SAS SSDs (SFF Solid State Drives in LFF Converters) |
|
|
HPE MSA 400GB 12G SAS Mixed Use LFF (3.5in) Converter Carrier 3yr Wty Solid State Drive |
P9M79A |
|
HPE MSA 800GB 12G SAS Mixed Use LFF (3.5in) Converter Carrier 3yr Wty Solid State Drive |
P9M80A |
|
MSA Large Form Factor (LFF) SAS DP Self-Encrypted Drives for MSA 2040 Array |
|
|
HPE MSA 4TB 12G SAS 7.2K LFF (3.5in) Midline Self Encrypted 1yr Warranty Hard Drive |
Q1H48A |
|
MSA Small Form Factor (SFF) SAS DP Self-Encrypted Drives for MSA 2040 Array |
|
|
HPE MSA 1.2TB 12G SAS 10K SFF (2.5in) Enterprise Self Encrypted 3yr Wty Hard Drive |
P9M81A |
|
|
|
|
NOTE:
NOTE:
|
|
|
Step 2d - Drive Enclosure Options |
|
Use any disk enclosure with large or small form factor, single or dual controller MSA 2040 storage systems. Each disk enclosure ships with two .5m mini-SAS to mini-SAS cables. |
|
HP MSA 2040 Energy Star LFF Disk Enclosure |
M0S96A |
|
HP D2700 Disk Enclosure |
AJ941A |
|
HPE MSA 2050 LFF Disk Enclosure |
Q1J06A |
|
HPE MSA 2050 SFF Disk Enclosure |
Q1J07A |
|
NOTE: • The MSA 2050 LFF and SFF Disk Enclosures are the recommended disk enclosures for capacity expansion on the MSA 2040 storage systems. • The use of MSA 2050 LFF and SFF Disk Enclosures with MSA 1040/2040/2042 storage requires requires GL225 array controller firmware, or newer. |
|
|
|
|
|
Step 2e - SAS Cable Options |
|
|
mini-SAS to mini-SAS Cables: |
|
|
HP External Mini SAS 1m Cable ALL |
407337-B21 |
|
HP External Mini SAS 2m Cable |
407339-B21 |
|
Step 3 - Other MSA 2040 Options |
|
|
Choose optional AC Power Cords (2 required) |
|
|
HP ProLiant 12 ft Power Cord |
227099-001 |
|
Power Cord, (Australia/China/New Zealand) |
227098-001 |
|
Power Cord, (Central Europe) |
157215-001 |
|
Power Cord, (United Kingdom/Hong Kong) |
157216-001 |
|
Power Cord, (Switzerland) |
157219-001 |
|
Power Cord, (Italy) |
157217-001 |
|
Power Cord, (Denmark) |
157218-001 |
|
Power Cord, (Japan) |
139867-001 |
|
Power Cord, (South East Asia/India) |
157220-001 |
|
|
|
|
Step 4 - Choose Supported Options For Fibre Channel Infrastructure |
||
|
Fibre Channel |
Model |
SKUs |
|
NOTE: Please visit http://www.hpe.com/storage/spock for compatibility details. |
|
|
|
FC HBAs |
|
|
|
HP StoreFabric SN1000Q 16GB 1-port PCIe Fibre Channel Host Bus Adapter |
QW971A |
|
|
HP StoreFabric SN1000Q 16GB 2-port PCIe Fibre Channel Host Bus Adapter |
QW972A |
|
|
|
|
|
|
HP StoreFabric SN1100E 16Gb Single Port Fibre Channel Host Bus Adapter |
C8R38A |
|
|
HP StoreFabric SN1100E 16Gb Dual Port Fibre Channel Host Bus Adapter |
C8R39A |
|
|
BladeSystem c-Class Fibre Channel Mezzanine HBAs |
|
|
|
QLogic QMH2562 8Gb Fibre Channel Host Bus Adapter for c-Class BladeSystem |
451871-B21 |
|
|
Emulex LPe1205 8Gb Fibre Channel Host Bus Adapter for c-Class BladeSystem |
456972-B21 |
|
|
C-class HBA |
|
|
|
HP QMH2572 8Gb Fibre Channel Host Bus Adapter for BladeSystem c-Class |
651281-B21 |
|
|
HP LPe1205A 8Gb Fibre Channel Host Bus Adapter for BladeSystem c-Class |
659818-B21 |
|
|
HP 82Q 8Gb 2-port PCIe Fibre Channel Host Bus Adapter |
AJ764A |
|
|
Fibre Channel |
Integrity |
|
|
HP 4Gb 1-port PCI-X 2.0 Fibre Channel Host Bus Adapter |
AB378B |
|
|
HP 4Gb 2-port PCIe Fibre Channel Host Bus Adapter |
AD300A |
|
|
HP 4Gb 1-port PCIe Fibre Channel Host Bus Adapter |
AD299A |
|
|
HP 4Gb 2-port PCIe Fibre Channel Host Bus Adapter |
AD355A |
|
|
HP PCIe 1-port 4Gb and 1-port 1000BT Adapter |
AD221A |
|
|
HP PCIe 2-port 4Gb and 2-port 1000BT Adapter |
AD222A |
|
|
HP PCIe 2-port 4Gb and 2-port 1000BSX Adapter |
AD393A |
|
|
HP PCI-X 1-port 4Gb FC and 1-port 1000BT Adapter |
AD193A |
|
|
HP PCI-X 2-port 4Gb FC and 2-port 1000BT Adapter |
AD194A |
|
|
HP PCI Express 1-port 8Gb Fibre Channel SR (QLogic) Adapter |
AH400A |
|
|
HP PCI Express 2-port 8Gb Fibre Channel SR (QLogic) Adapter |
AH401A |
|
|
HP 8Gb 1-port PCIe Fibre Channel Host Bus Adapter |
AH402A |
|
|
HP 8Gb 2-port PCIe Fibre Channel Host Bus Adapter |
AH403A |
|
|
Brocade Fibre Channel HBAs |
|
|
|
HP 81B 8Gb 1-port PCIe Fibre Channel Host Bus Adapter |
AP769B |
|
|
HP 82B 8Gb 2-port PCIe Fibre Channel Host Bus Adapter |
AP770B |
|
|
Emulex Fibre Channel HBAs |
|
|
|
HP 81E 8Gb 1-port PCIe Fibre Channel Host Bus Adapter |
AJ762B |
|
|
HP 82E 8Gb 2-port PCIe Fibre Channel Host Bus Adapter |
AJ763B |
|
|
QLogic Fibre Channel HBAs |
|
|
|
HP 81Q 8Gb 1-port PCIe Fibre Channel Host Bus Adapter |
AK344A |
|
|
HP 82Q 8Gb 2-port PCIe Fibre Channel Host Bus Adapter |
AJ764A |
|
|
Integrity server blades |
|
|
|
QLogic QMH2562 8Gb Fibre Channel Host Bus Adapter for c-Class BladeSystem |
451871-B21 |
|
|
Emulex LPe1205 8Gb Fibre Channel Host Bus Adapter for c-Class BladeSystem |
456972-B21 |
|
|
PremierFlexOM4 type cables |
HP Premier Flex LC/LC Multi-mode OM4 2 fiber 1m Cable |
QK732A |
|
HP Premier Flex LC/LC Multi-mode OM4 2 fiber 2m Cable |
QK733A |
|
|
HP Premier Flex LC/LC Multi-mode OM4 2 fiber 5m Cable |
QK734A |
|
|
HP Premier Flex LC/LC Multi-mode OM4 2 fiber 15m Cable |
QK735A |
|
|
HP Premier Flex LC/LC Multi-mode OM4 2 fiber 30m Cable |
QK736A |
|
|
HP Premier Flex LC/LC Multi-mode OM4 2 fiber 50m Cable |
QK737A |
|
|
OM3 FC LC-LC cables |
HP LC to LC Multi-mode OM3 2-Fiber 0.5m 1-Pack Fiber Optic Cable |
AJ833A |
|
HP LC to LC Multi-mode OM3 2-Fiber 1.0m 1-Pack Fiber Optic Cable |
AJ834A |
|
|
HPE LC to LC Multi-mode OM3 2-Fiber 2.0m 1-Pack Fiber Optic Cable |
AJ835A |
|
|
HP LC to LC Multi-mode OM3 2-Fiber 5.0m 1-Pack Fiber Optic Cable |
AJ836A |
|
|
HP LC to LC Multi-mode OM3 2-Fiber 15.0m 1-Pack Fiber Optic Cable |
AJ837A |
|
|
HP LC to LC Multi-mode OM3 2-Fiber 30.0m 1-Pack Fiber Optic Cable |
AJ838A |
|
|
HP LC to LC Multi-mode OM3 2-Fiber 50.0m 1-Pack Fiber Optic Cable |
AJ839A |
|
|
|
||
|
Step 4a - Choose Supported Options For SAS Infrastructure |
||
|
Supported options |
Mini-SAS Cables |
|
|
HP 1.0m External Mini SAS High Density to Mini SAS Cable |
716189-B21 |
|
|
HP 2.0m External Mini SAS High Density to Mini SAS Cable |
716191-B21 |
|
|
HP 4.0m External Mini SAS High Density to Mini SAS Cable |
716193-B21 |
|
|
NOTE: These cables are used to connect 6Gb SAS initiator to MSA 2040 SAS controller. These are not used for connecting to a disk enclosure. |
|
|
|
HP External 1.0m (3ft) Mini-SAS HD 4x to Mini-SAS HD 4x Cable |
716195-B21 |
|
|
HP External 2.0m (6ft) Mini-SAS HD 4x to Mini-SAS HD 4x Cable |
716197-B21 |
|
|
HP External 4.0m (13ft) Mini-SAS HD 4x to Mini-SAS HD 4x Cable NOTE: These cables are used to connect 12Gb SAS initiator to MSA 2040 SAS controller. These are not used for connecting to a disk enclosure. |
716199-B21 |
|
|
SAS Host Bus Adapters (HBAs) |
|
|
|
HP H241 12Gb 2-ports Ext Smart Host Bus Adapter |
726911-B21 |
|
|
HP H221 PCIe 3.0 SAS Host Bus Adapter |
729552-B21 |
|
|
SAS Controllers |
|
|
|
HP Smart Array P741m/4GB FBWC 12Gb 4-ports Ext Mezzanine SAS Controller |
726782-B21 |
|
|
HP Smart Array P721m/2GB FBWC 6Gb 4-ports Ext Mezzanine SAS Controller |
650072-B21 |
|
|
HP Smart Array P721m/512 FBWC 6Gb 4-ports Ext Mezzanine SAS Controller |
655636-B21 |
|
|
HP Smart Array P712m/256 6Gb 2-ports Int/2-ports Ext Mezzanine SAS Controller |
488348-B21 |
|
|
HP Smart Array P711m/1G 6Gb FBWC 4-ports Ext Mezzanine SAS Controller |
513778-B21 |
|
|
HP Smart Array P441/4GB FBWC 12Gb 2-ports Ext SAS Controller |
726825-B21 |
|
|
HP Smart Array P431/2GB FBWC 12Gb 2-ports Ext SAS Controller |
698531-B21 |
|
|
Switches |
|
|
|
HP 6Gb SAS Switch Single Pack for HP BladeSystem c-Class |
BK763A |
|
|
HP 6Gb SAS Switch Dual Pack for HP BladeSystem c-Class |
BK764A |
|
|
|
||
|
Step 4b - Choose Supported Options For 10GbE Infrastructure For detailed information on NICs and OS initiator please go to: http://www.hpe.com/storage/spock |
||
|
Copper Cable |
HP BladeSystem c-Class 10GbE SFP+ to SFP+ 0.5m Direct Attach Copper Cable |
487649-B21 |
|
HP BladeSystem c-Class 10GbE SFP+ to SFP+ 1m Direct Attach Copper Cable |
487652-B21 |
|
|
HP BladeSystem c-Class 10GbE SFP+ to SFP+ 3m Direct Attach Copper Cable |
487655-B21 |
|
|
HP BladeSystem c-Class 10GbE SFP+ to SFP+ 5m Direct Attach Copper Cable |
537963-B21 |
|
|
HP BladeSystem c-Class 10GbE SFP+ to SFP+ 7m Direct Attach Copper Cable |
487658-B21 |
|
|
DAC Cable |
HPE X242 10G SFP+ to SFP+ 1m Direct Attach Copper Cable |
J9281B |
|
HPE X242 10G SFP+ to SFP+ 3m Direct Attach Copper Cable |
J9283B |
|
|
HPE X242 10G SFP+ to SFP+ 7m Direct Attach Copper Cable |
J9285B |
|
|
HPE FlexNetwork X240 10G SFP+ to SFP+ 0.65m Direct Attach Copper Cable |
JD095C |
|
|
HPE FlexNetwork X240 10G SFP+ to SFP+ 1.2m Direct Attach Copper Cable |
JD096C |
|
|
HPE FlexNetwork X240 10G SFP+ to SFP+ 3m Direct Attach Copper Cable |
JD097C |
|
|
HPE FlexNetwork X240 10G SFP+ to SFP+ 5m Direct Attach Copper Cable |
JG081C |
|
|
HPE FlexNetwork X240 10G SFP+ SFP+ 7m Direct Attach Copper Cable |
JC784C |
|
|
|
||
|
Step 5; Software |
||
|
Software |
The MSA advanced virtualization functionalities are available as salable options for new and existing MSA 2040. A firmware upgrade may be required. NOTE: The Advanced Data Services Suite includes a Performance Tiering LTU, 512 Snapshot Software LTU, and the Remote Snap Software LTU. |
|
|
|
HPE MSA Advanced Data Services Suite LTU |
Q0H99A |
|
|
HPE MSA Advanced Data Services Suite E-LTU |
Q0H99AAE |
Technical Specifications
|
MSA 2040 |
POWER REQUIREMENTS |
|
|
Input Power Requirements |
|
|
|
Max Input Power |
100-240 VAC, 50/60 Hz., 4.5-1.9A; 48-60 VDC 10.4A/8.3A |
|
|
Heat Dissipation |
1622 BTU/hr |
|
|
TEMPERATURE AND HUMIDITY RANGES |
||
|
Operating Temperature |
41°F to 104°F (5°C to 40°C) |
|
|
Shipping Temperature |
-40°F to 158°F (-40°C to 70°C) |
|
|
Operating Humidity |
10% to 90% RH @ 104°F (40°C) non-condensing |
|
|
Non-Operating Humidity |
Up to 93% RH @ 104°F (40°C) |
|
|
DECLARED ACOUSTIC NOISE LEVELS |
||
|
Sound Power |
A weighted sound power LWAd=6,75 B |
|
|
Sound Pressure |
A weighted sound pressure LpAm - 55dB |
|
|
SHOCK AND VIBRATION |
||
|
Shock, Operational |
3G's for 11 milliseconds |
|
|
Shock, Non-Operational |
15G 11ms half sine |
|
|
Vibration, Operational |
5-500Hz, 0.14 Grms shaped |
|
|
Vibration, Non-Operational |
3-365-3Hz, 1.22 Grms,z-axis,0.85 Grms, X&Y axis shaped spectrum |
|
|
PHYSICAL |
||
|
Height |
3.5 in/ 8.9 cm |
|
|
Depth (excluding cables) (back of ear to back of controller handle) |
MSA 2040 SFF 24-bay array: 19.5 in / 49.5 cm |
|
|
Width (body only) |
17.6 in / 44.7 cm (w/ ears 19 in / 48.26 cm) |
|
|
Chassis Weight |
MSA 2040 LFF chassis: 31 lbs. (DC-pwr model: 32.6 lbs) |
|
|
|
||
|
MSA 2040 Controllers: |
User Interface |
Status and activity provided via management interfaces. Status Indicators on front of Controller |
|
RAID Support |
0, 1, 3, 5, 6, 10, 50 |
|
|
Cache Memory |
4GB Read/Write. ECC protection with backup to Flash memory (indefinite backup) |
|
|
Cache Backup |
ECC protection with back up to flash memory (indefinite backup) |
|
|
Upgradeable Firmware |
yes |
|
|
Disk Drive and Enclosure Protocol Support |
6 Gb SAS - Serial Attached SCSI |
|
|
Host Ports |
FC: 4 x 8Gb Fibre Channel (per controller) |
|
|
SAS: 4 x 12 Gb mini-SAS HD using SAS 3.0 SFF-8644 connect interface (per controller) |
||
|
Expansion Port |
SAS (SFF8088) 4x lane 6 Gb SAS |
|
|
Weight, controller |
MSA 2040 SAN Controllers 4.8 lbs. |
|
|
|
||
|
MSA 2040 |
Safety |
UL 60950-1 (USA) |
|
CAN/CSA-C22.2 No.60950-1-03 (Canada) |
||
|
EN 60950-1 (European Union) |
||
|
GS mark (Germany) |
||
|
IEC 60950-1 (International) |
||
|
CCC Mark (power supply only, China PRC) |
||
|
Electromagnetic Compatibility |
VCCI:2008-04 Class A (Japan) |
|
|
FCC 15:109(g) Class A (USA) |
||
|
ICES-003:2004 Class A (Canada) |
||
|
EN55022 : (European Union Class A); CISPR 22 (International Class A) |
||
|
EN61000-3-2 : (Harmonics) (European Union) |
||
|
EN61000-3-3 : (Flicker) (European Union) |
||
|
EN 55024 (European Union, Immunity, Class A);CISPR 24 (International Immunity, Class A) |
||
|
AS/NZS CISPR 22, Class A (Australia, New Zealand) |
||
|
CNS 13438 Taiwan, Class A (Taiwan) |
||
|
KN22 Class A (Emissions Class A); KN24 (Immunity) (S Korea) |
||
|
RoHS and WEEE |
RoHS-6/6 Compliance, China RoHS, WEEE |
|
|
Country Approvals |
United States ,Australia/New Zealand, Canada, China (PRC), European Union, Germany (GS Mark), Japan, South Korea, Taiwan |
|
Summary of Changes
|
Date |
Version History |
Action |
Description of Change |
|
05-Mar-2018 |
From Version 28 to 29 |
Added |
Added MSA 2050 SFF and LFF Disk Enclosures as supported options on the MSA 2040 storage systems. |
|
05-Feb-2018 |
From Version 27 to 28 |
Changed |
Features, Family Information, and Configuration Information were revised. |
|
06-Nov-2017 |
From Version 26 to 27 |
Changed |
Added new drive capacities. |
|
02-Oct-2017 |
From Version 25 to 26 |
Changed |
Changes made throughout the QuickSpecs |
|
26-Aug-2016 |
From Version 24 to 25 |
Changed |
Changes made to the Overview, Features and Configuration Information Sections. |
|
15-Aug-2016 |
From Version 23 to 24 |
Changed |
Changes made throughout the QuickSpecs |
|
13-May-2016 |
From Version 22 to 23 |
Changed |
Changes made to the Configuration Info and Features Sections. |
|
31-Mar-2016 |
From Version 21 to 22 |
Changed |
Changes made throughout the QuickSpecs. |
|
16-Feb-2016 |
From Version 20 to 21 |
Changed |
Changes made throughout the QuickSpecs. |
|
04-Dec-2015 |
From Version 19 to 20 |
Added |
Made two important updates on: |
|
01-Dec-2015 |
From Version 18 to 19 |
Changed |
Changes made throughout the QuickSpecs. Rebranded Edition. |
|
18-Sept-2015 |
From Version 17 to 18 |
Changed |
Changed made to the Configuration Information section. |
|
21-Aug-2015 |
From Version 16 to 17 |
Changed |
Changes made to the Models, Features, Software and Configuration Information Sections. |
|
17-Aug-2015 |
From Version 15 to 16 |
Changed |
Changes made throughout the QuickSpecs. |
|
19-Jun-2015 |
From Version 14 to 15 |
Changed |
1. New Link to the ENERGY STAR listing on the EPA website 2. Correction to one of the ENERGY STAR SKU 3. Formatting changes and alignment 4. Update of the Benchmark Performance results 5. Note on the GL210 storage pool limit |
|
1-Jun-2015 |
From Version 13 to 14 |
Changed |
Changes made throughout the QuickSpecs. |
|
10-Apr-2015 |
From Version 12 to 13 |
Changed |
What´s new, Models, Family Information, Configuration Information sections were updated |
|
3-Apr-2015 |
From Version 11 to 12 |
Changed |
Changes made to the What´s New, Models, Family Info, Optional SW and Config Info. Sections. |
|
30-Mar-2015 |
From Version 10 to 11 |
Changed |
SKUs descriptions were updated, Obsolete SKU were removed. |
|
0-Jan-1900 |
|
Added |
Support for 12G SFF and LFF w Hard Disk Drives |
|
12-Dec-2014 |
From version 9 to 10 |
Changed |
Added the Configuration Table for mixing SFPs. on the Features Section |
|
1-Dec-2014 |
From Version 8 to 9 |
Changed |
Changes made throughout the QuickSpecs. |
|
29-Sep-2014 |
From Version 7 to 8 |
Changed |
Changes made throughout the QuickSpecs. |
|
2-May-2014 |
From Version 6 to 7 |
Changed |
Operate and Support and Basic Care were revised. |
|
25-Apr-2014 |
From Version 5 to 6 |
Changed |
Models and mini-SAS cables were revised. |
|
31-Mar-2014 |
From Version 4 to 5 |
Changed |
Hard Drives were revised. |
|
9-Dec-2013 |
From Version 3 to 4 |
Changed |
Changes made to the What's New section:
Introducing a new 1.2 TB SFF 10K Enterprise Hard Drive (E7W47A)
Adding two new MSA 2040 bundles using the new 1.2 TB SFF SAS Hard Drive
C8R16A - HPE MSA 2040 SAN Dual Controller 24x1.2TB SAS 10K SFF HDD 28.8TB Bundle
C8S56A - HPE MSA 2040 SAS Dual Controller 24x1.2TB SAS 10K SFF HDD 28.8TB Bundle |
|
30-Sep-2013 |
From Version 2 to 3 |
Changed |
Changes made throughout the entire QuickSpec. Changed What's New in the MSA 2000 array family to: Adding 12Gb SAS Models -support up to Four 6Gb/12Gb SAS connections per controller. Adding support for 1GbE/10GbE iSCSI to MSA 2040 SAN Controller. NOTE: Customers must upgrade their MSA 2040 controller firmware to GL101 or later for iSCSI functionality. Adding support for HPE MSA 2040 SAN Controller to offer a combination of host interface protocols by mixing FC and iSCSI SFPs on the same controller. Please refer to the valid Configuration Table for Mixing SFPs in this doc. Adding support for new 1.2 TB SFF SAS and 4TB LFF SAS Midline drive. |
|
21-Aug-2013 |
From Version 1 to 2 |
Changed |
Changes made in the Family Information and Configuration Information sections. |